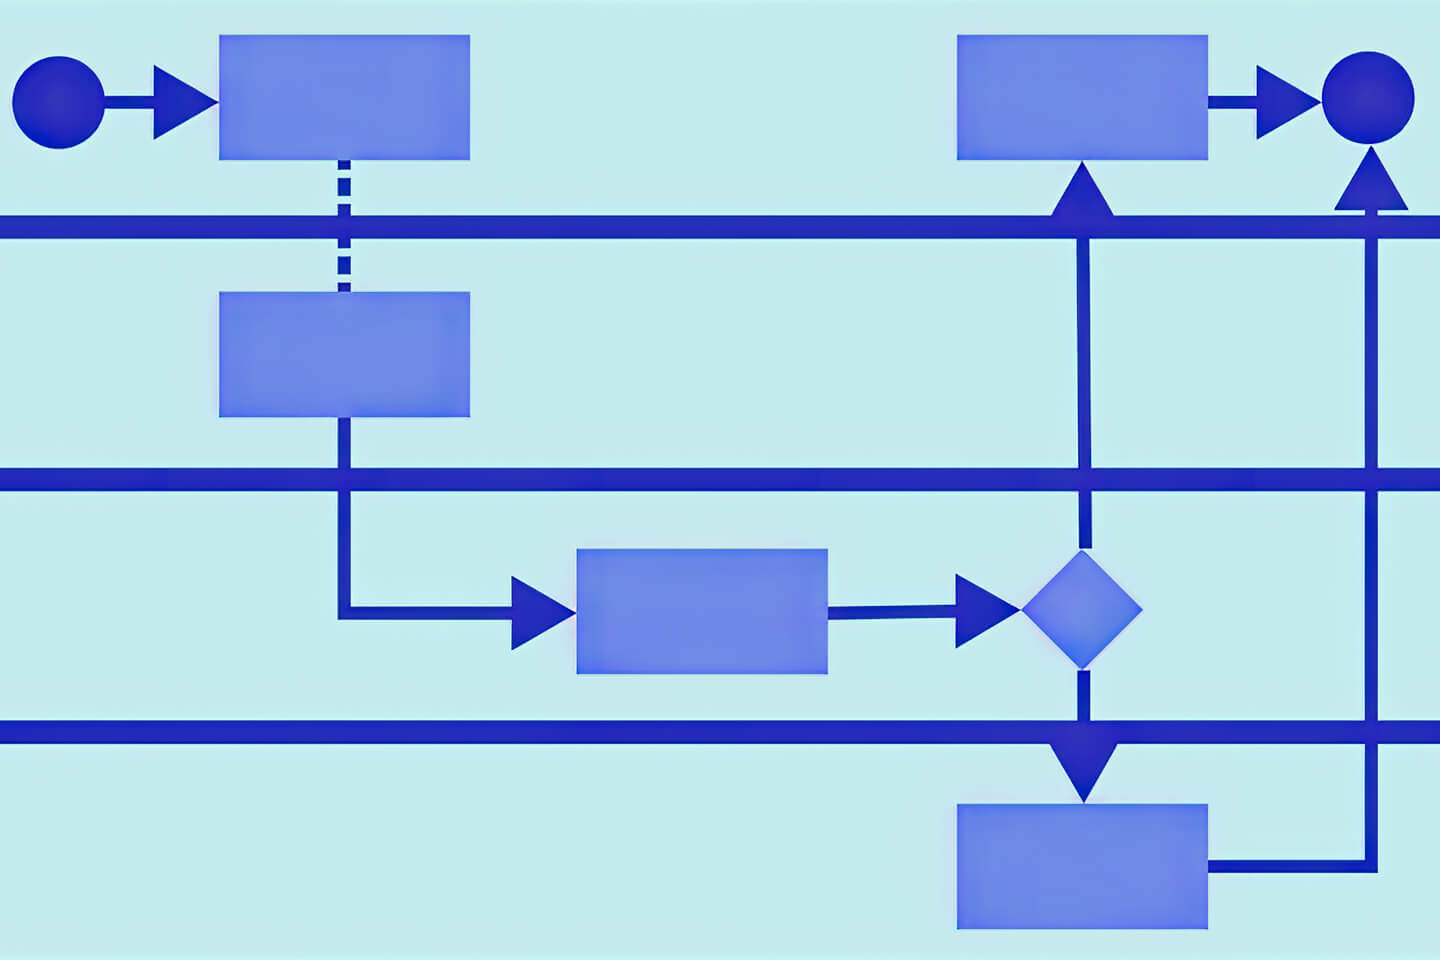
A Swim Lane Diagram is a process flow diagram that visually distinguishes job sharing and responsibilities for a business process. Swim lanes may be arranged either horizontally or vertically. The swim lane differs from other flowcharts in that processes and decisions are grouped visually by placing them in lanes, with one lane representing a person, department or organization. Swim Lane Diagrams first appeared in the 1940s as a variation of the process flow chart called multi-column charts. They were called Swim Lane Diagrams by Geary Rummler and Alan Brache in their book Improving Processes (1990). (Wikipedia).
The Swim Lane Diagram is the generally accepted flowcharting method in most businesses. In our experience, we find many problems with the Swim Lane Diagram and as a result, we have developed our own methodology, The Perigon Method, which better addresses the needs of all types of business users and analysts for any organization or industry.

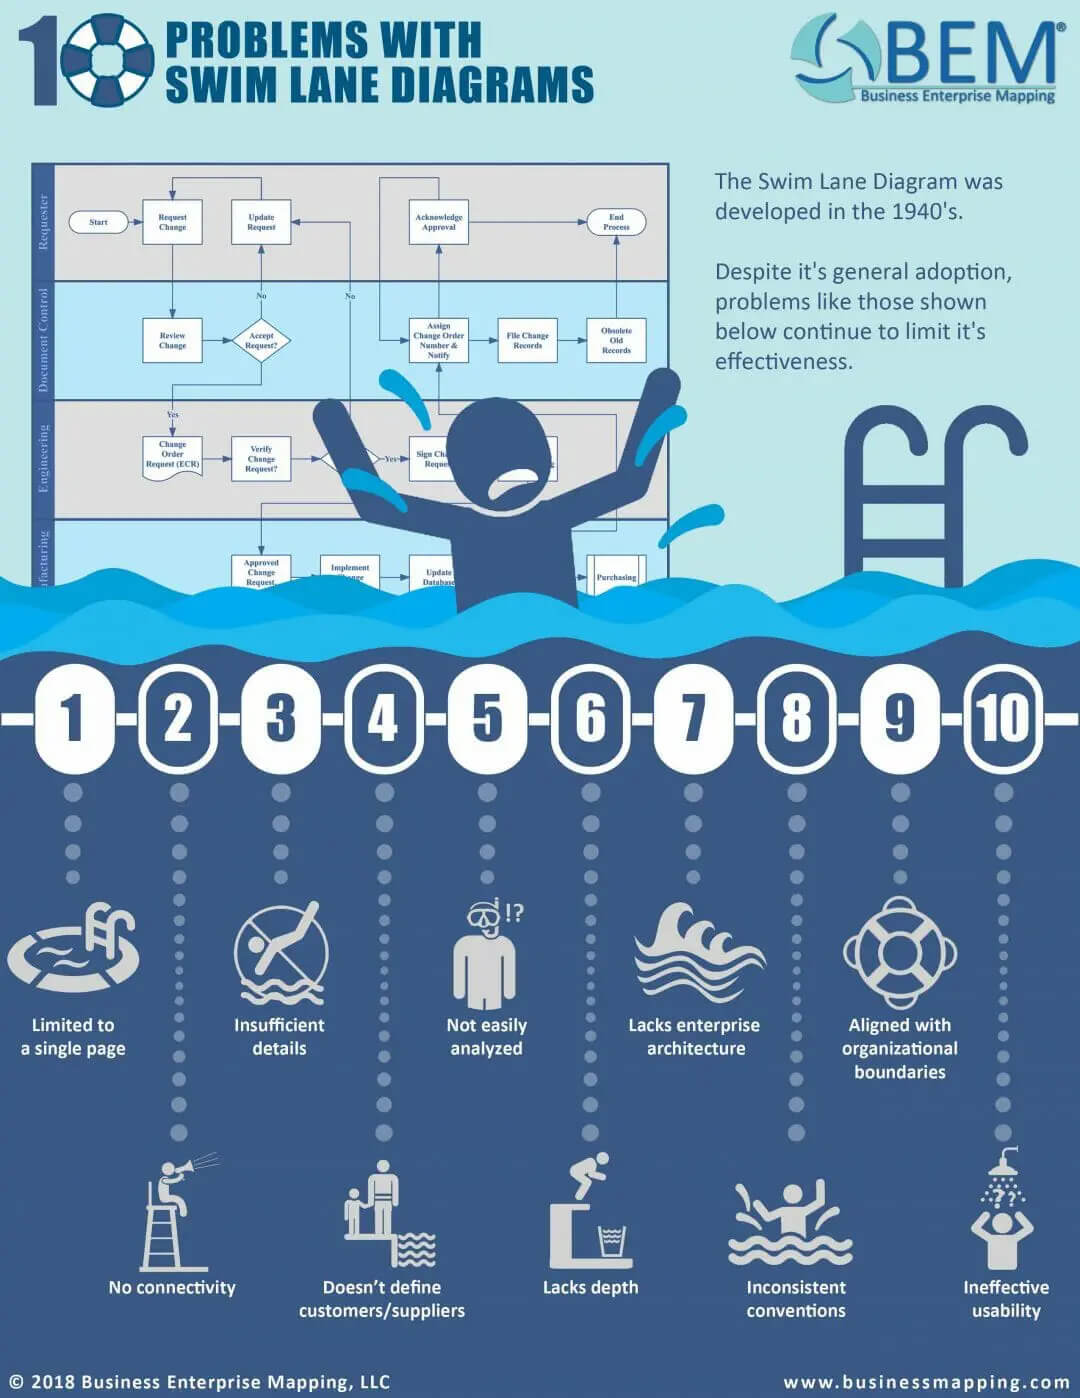
10 Problems - Swim Lane Diagram
1. Limited to a single page.
In general, Swim Lane Diagrams are limited to what the analyst can fit onto one or two pages. This means that needed detail is simply not available to the many users.
2. No connectivity.
Swim Lane Diagrams do not show connected business processes or systems; therefore, the user doesn’t know where one process ends and another begins, leading to gaps or overlaps. The process to process connection should be seamless.
3. Insufficient detail.
A process map must detail the “what”, “when”, “who”, “why”, “where” and point to the “how”. Most of this detail is missing from Swim Lane Diagrams or is inconsistent across business functions.
4. Doesn't define customers/suppliers.
Swim Lanes Diagrams miss defining customer-suppliers in terms of process relationships. They are usually defined in terms of organizational or departmental relationships.
5. Not easily analyzed.
Swim Lanes Diagrams are generally mapped at a high level, which does not provide sufficient detail to analyze effectiveness and efficiency.
6. Misses knowledge.
Swim Lane Diagrams are two-dimensional and do not address the five levels of an organization, e.g. enterprise, system, process, task, and knowledge. The enterprise contains business systems, business systems contain processes, processes lay out the sequence of tasks, which then access the necessary knowledge.
7. Lacks enterprise architecture.
Swim Lane Diagrams ignore enterprise architecture. All enterprises have a business model architecture that drives workflow. BEM defines a common business model architecture to be 1) Strategic, 2) Resource, 3) Value Proposition Delivery, and 4) Improvement. While we consistently see thoughtful business model designs around Value Proposition Delivery, in most cases, the other three groups are missing or show large gaps.
8. Aligned with organization boundaries.
Swim Lane Diagrams are a severe hindrance to actually understanding how a process flows. Organizations are generally structured vertically with many pockets and silos while workflows horizontally. While organizations are frequently reorganized, process alignment is more consistent and stable.
9. Inconsistent conventions.
Swim Lane Diagrams are often constructed inconsistently with flowcharting conventions being abused or used differently for different purposes. This variation makes it extremely difficult to read and consistently understand workflow across a business.
10. Ineffective for usability.
Because of the deficiencies illustrated above, Swim Lanes Diagrams are difficult to use for anything other than a basic executive overview. These diagrams are not valuable when trying to understand the work that actually takes place in a process. They have to be supplemented with additional information, usually SOPs to provide meaning to the work description. Process Maps should be usable from the stock room to the boardroom, serving as a universal language understood by all parties.
The Swim Lanes Diagram has existed for over half a century without much evidence of continuous improvement. While it is still the generally accepted standard for process flow documentation, we believe the shortcomings identified above make it extremely difficult for the Swim Lane Diagram to be utilized effectively. It is long overdue for retirement and should be replaced with a better approach that meets the needs of modern business structures.
Further Reading: THE PERIGON METHOD

